Cutting Edge Optronics has developed a laser diode array package with minimal bar-to-bar spacing. These High Density Stack (HDS) packages allow for a power density increase on the order of ~ 2.5x when compared to industry-standard arrays.
This work contains an overview of the manufacturing process, as well as representative data for 5-, 10-, and 20-bar arrays. Near-field and power vs. current data is presented in each case. Power densities approaching 15 kW/cm² are presented. In addition, power and wavelength are presented as a function of pulse width in order to determine the acceptable operational parameters for this type of array. In the low repetition rate Nd:YAG pumping regime, all devices are shown to operate with relatively low junction temperatures.
A discussion of future work is also presented, with a focus on extending the HDS architecture to reliable operation at 300W per bar. This will enable power densities of approximately 25 kW/cm².
Ryan Feeler and Edward Stephens
Northrop Grumman Cutting Edge Optronics, 20 Point West Boulevard, St. Charles, MO 63301
1. INTRODUCTION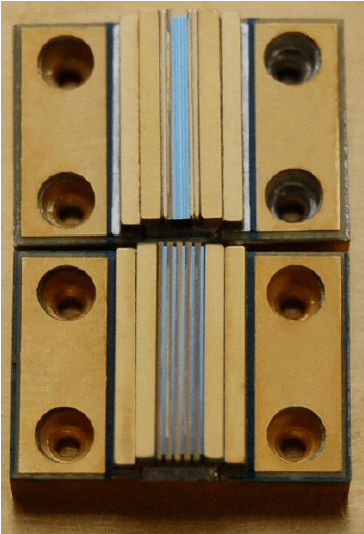
Laser diode arrays are used in a variety of defense and aerospace applications. Two of the most common uses are illumination and solid-state laser (SSL) pumping, in which the radiation from the diode lasers is used to excite the laser crystal in order to generate light. The SSLs can then be used in a number of configurations and applications, including range finding and target designation.
In many SSL applications it is common to operate the laser diode arrays in pulsed, or quasi-continuous wave (QCW) mode. In this regime the diodes are electrically pumped with a pulse width that is commonly on the order of the upper state lifetime of the laser gain medium. For example, Nd:YAG lasers are typically pumped with pulse widths on the order of 200 µs. This pumping scenario leads to efficient laser designs since most of the pump light that is absorbed by the laser crystal can be extracted from the system. The repetition rate of the diode pumps is also defined by the application. Many range finding applications operate in the 10-30 Hz range, and many direct diode illuminations operate at around 60 Hz to match the frame rate on commercial off the shelf (COTS) camera systems.
QCW diode pumping holds several advantages over CW diode pumping in SSL systems. First, QCW pumping creates a lower average thermal load in the laser gain medium. This simplifies the cooling of the system and also enables higher beam quality lasers due to the reduced thermal lensing effects. Second, QCW pumping allows the diodes to be operated at higher peak power than is possible with CW pumping. This leads to SSL systems with higher peak powers.
Northrop Grumman Cutting Edge Optronics (NGCEO) has been manufacturing QCW laser diode arrays for over a decade in a variety of configurations. A schematic of the standard manufacturing process for a QCW diode array is shown in Figure 1. In the first step, a diode bar is soldered to a heatsink. A heatsink with a coefficient of thermal expansion (CTE) near that of the bar (~ 6 ppm/K in the case of GaAs) is used. This allows for the use of hard solders such as eutectic AuSn, which minimizes solder creep and promotes a high degree of reliability. The subassembly created when a bar is soldered to a heatsink is known as a Mounted Bar Assembly (MBA).
In the next step of the standard manufacturing process, a number of MBAs are soldered together and attached to a ceramic backplane and electrical contacts to create a diode array. The electrical contacts also serve as large heatsinks on the end of the array. The bar-to-bar spacing, or pitch, is defined primarily by the thickness of the heatsink and whether there is any space between the MBAs. Pitch values ranging from 350 µm to 2 mm are common in the industry today. The number of bars in the array is determined by the customer specification and is directly related to the desired output power of the device. The array can be subsequently attached to either a water- or conductively-cooled heatsink
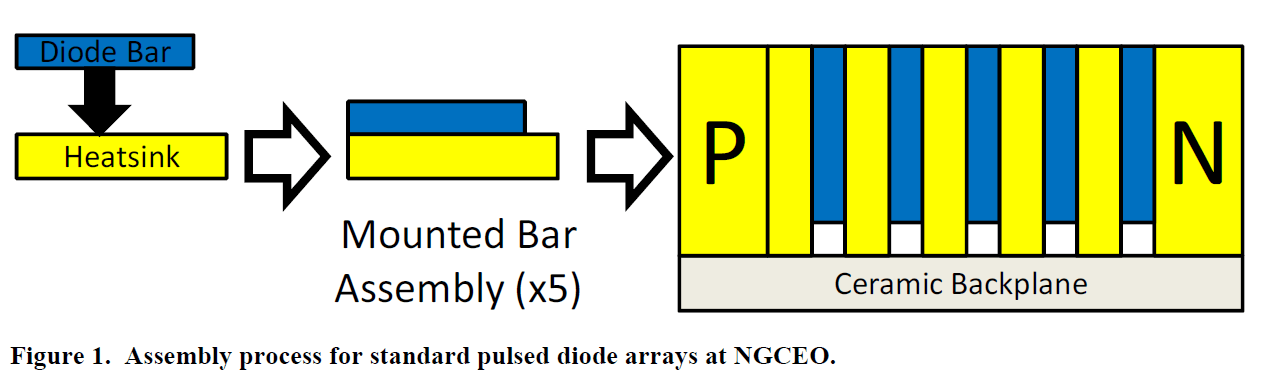
In defense-related applications, it is often advantageous for the laser diode arrays to have a very high output power density. High diode output power densities enable the use of smaller laser crystals and also have a direct impact on the size, weight, and cooling requirements of the resulting laser system. For arrays built using the process in Figure 1 using COTS diode bars rated at 200-300 W/bar, the resulting power density is 5-8 kW/cm².
There are several ways to increase the optical power density of a laser diode array. The first is to increase the output power of each of the diode bars that comprises the array. Additionally, optical methods (e.g. interleaving, beam combining) can be used to generate arrays with higher power densities.
NGCEO has created a new array design that eliminates the heatsinks from between the diode bars and drastically reduces the bar-to-bar pitch. This design is called the High Density Stack (HDS). A schematic of this manufacturing process is shown in Figure 2. In this process, a stack of laser diode bars is joined together using AuSn solder. This stack is then attached to a ceramic backplane and electrical contacts in a subsequent soldering step. The resulting array has a bar-to-bar pitch of ~ 150 µm. This pitch is approximately 43% of the smallest industry-standard pitch that can be obtained from the method shown in Figure 1, above. This leads to optical power densities that are approximately 2.3 times higher than can be obtained using standard manufacturing methods.
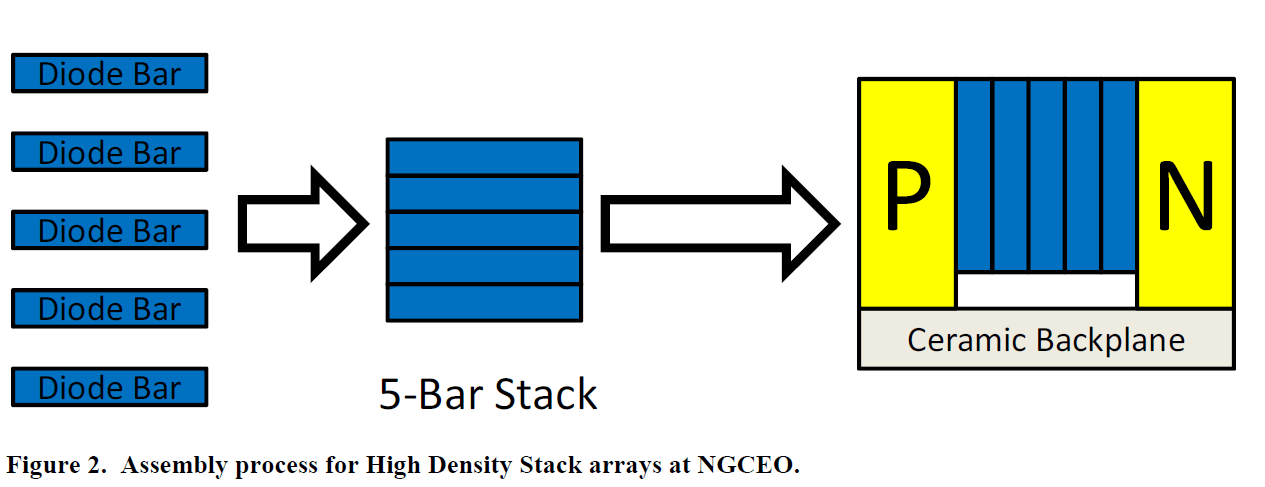
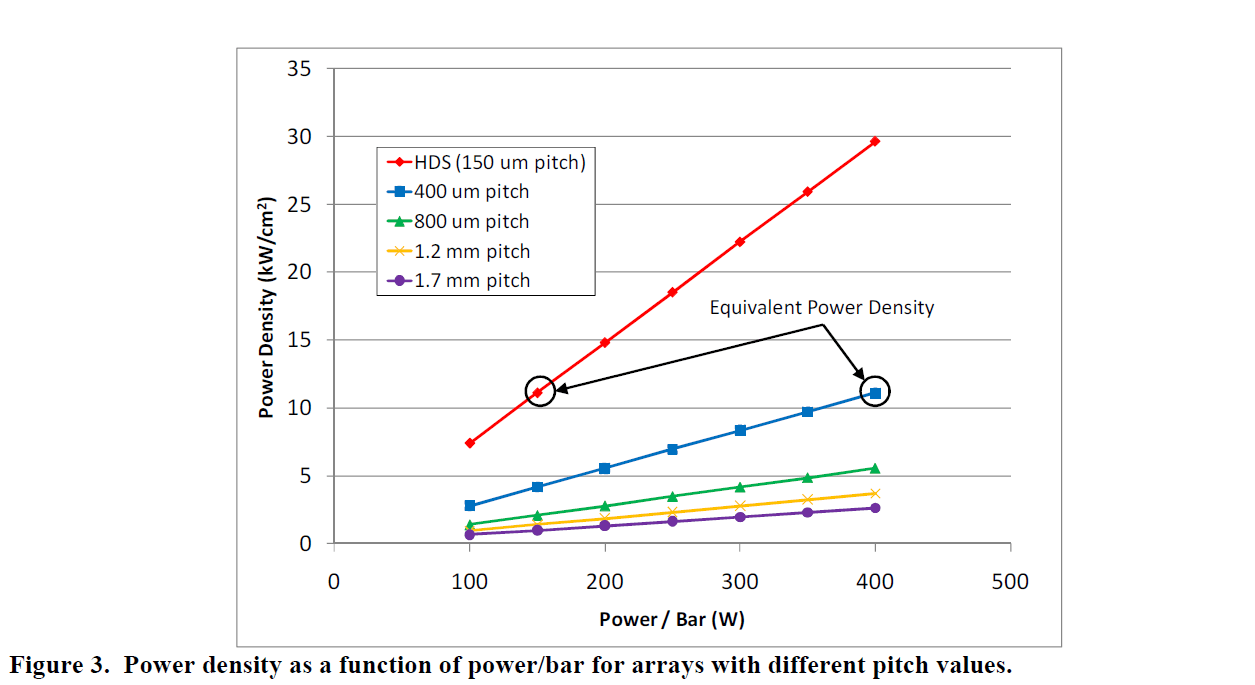
Figure 3 contains a graph of diode array power densities (in kW/cm²) as a function of the power per bar and the bar-to-bar pitch. The data illustrates that by utilizing the HDS architecture, significant increases in power densities can be achieved. At a nominal output power of 150 W/bar, the 10-bar HDS array has a power density ~ 2.7 times greater than that obtained from a standard array with 400 µm pitch. In fact, a 10-bar HDS array operating at 150 W/bar has the exact same power density as a 10-bar, 400 µm pitch array operating at 400 W/bar. This gives a system designer greater flexibility when selecting diode arrays for his/her application. Bars with lower peak power can be selected in order to operate further from the catastrophic optical damage (COD) limit, or to make use of lower-current diode drivers.
While the increased optical power density of the High Density Stack arrays is a desirable feature, the array design possesses an intrinsic limitation. The absence of the interposing heatsinks means that all of the heat generated by the interior bars must travel through the adjacent bars to the electrical contacts. As a result, the allowable operating envelope of the HDS arrays is smaller than the operating envelope of arrays built using standard manufacturing processes. One goal of this work is to define the operating envelope in which the HDS arrays can be used reliably.
2. EXPERIMENTAL DATA
The bars used for this experiment were designed and fabricated by NGCEO specifically for high power QCW operation. The bars are 1cm in width and have a 1mm cavity length with a fill factor of approximately 83%, and the output facets are passivated to prevent oxidation. These bars are nominally rated as 200W bars and achieve that power level at 175-180 A. In a standard package, this bar has been shown to have > 50% electrical-to-optical efficiency at temperatures ≤ 70 ºC and has also been shown to withstand significant thermal shocks [1]. In addition, this bar/package combination has been shown to have device lifetimes in excess of 13 billion shots [2]. This proven bar is therefore an excellent candidate for use in the HDS arrays.
In order to determine the operating envelope of the HDS arrays, 5-, 10-, and 20-bar arrays were fabricated using the process highlighted in Figure 2, above. All devices were fabricated from the same bar lot in order to allow for direct comparison of the data sets. In the case of the 5- and 10-bar stacks, the stack was built using a single soldering step. In the case of the 20-bar stack, two 10-bar stacks were joined together in a subsequent soldering step.
Free Engineering Consultation>>
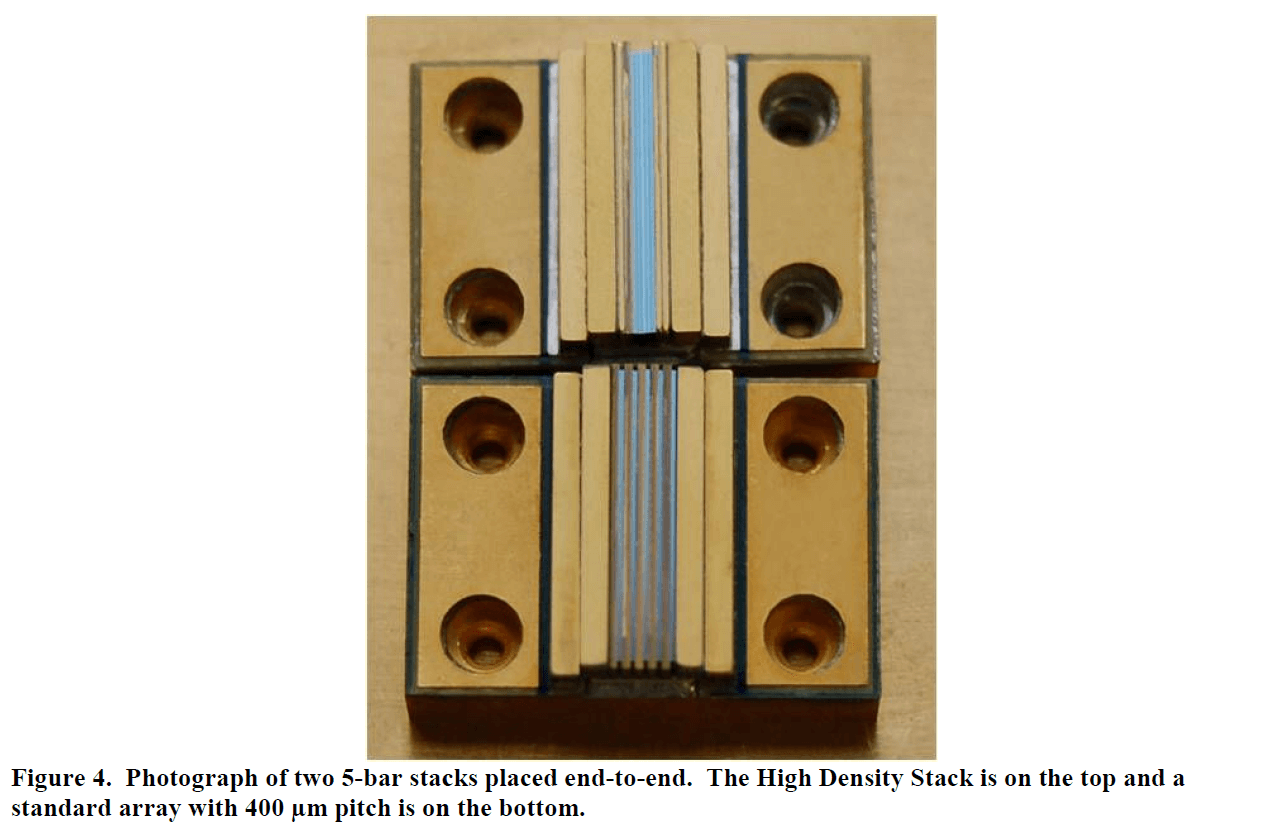
A picture of a 5-bar HDS array is shown in Figure 4, directly adjacent to a standard array with 400 µm pitch. In this case additional CuW heatsinks were added to the outside of the 5-bar stack so that the entire assembly could maintain the same form factor as the standard assembly for ease of testing. However it is clear that the emission area is significantly smaller for the HDS array. The total emission area of the standard array is 1cm x 1.6mm, while the emission area for the HDS array is 1cm x 0.6mm. For the case of two five-bar arrays operating at the same output power, the HDS array therefore has a 2.6 times greater power density.
The difference in power density can also be illustrated by looking at near field images. Near field images were obtained from the 5-bar HDS array and a 5-bar array with 400 µm pitch are shown in Figure 5. This clearly shows the advantage of increased power density associated with the HDS array.

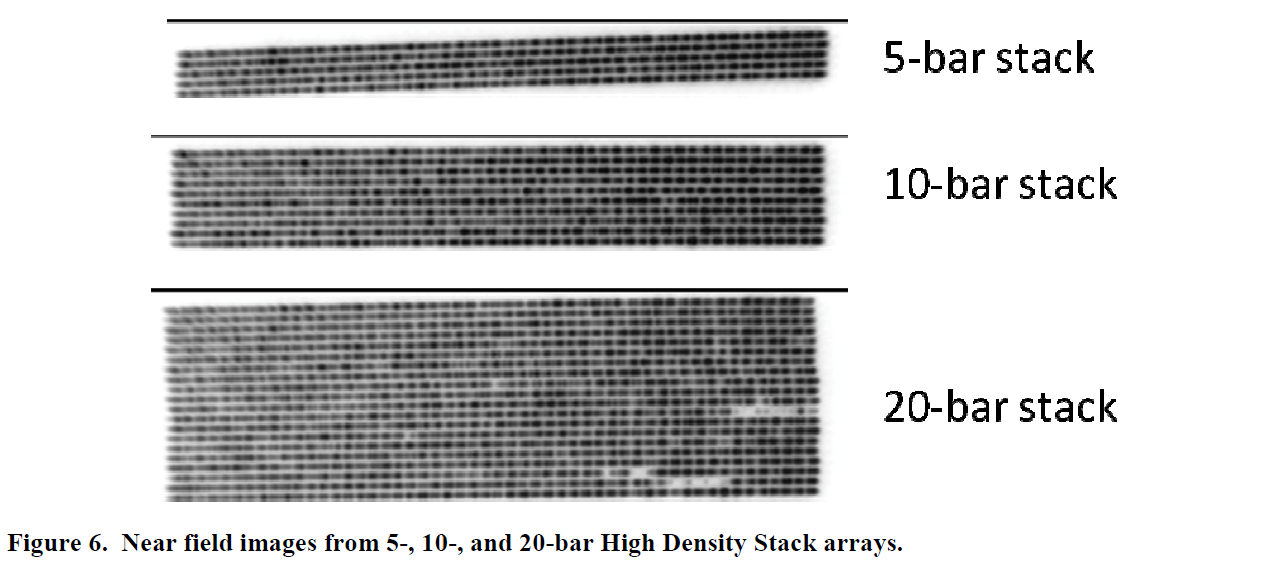
Near field images for all three stacks are shown in Figure 6. In the 5- and 10-bar stacks, each of the emitters in all of the bars is lasing. In the 20-bar stack, however, three bars contained multiple emitters with little or no emission. This results in a lower peak power per bar for the 20-bar stack even at low average currents, as will be shown below.
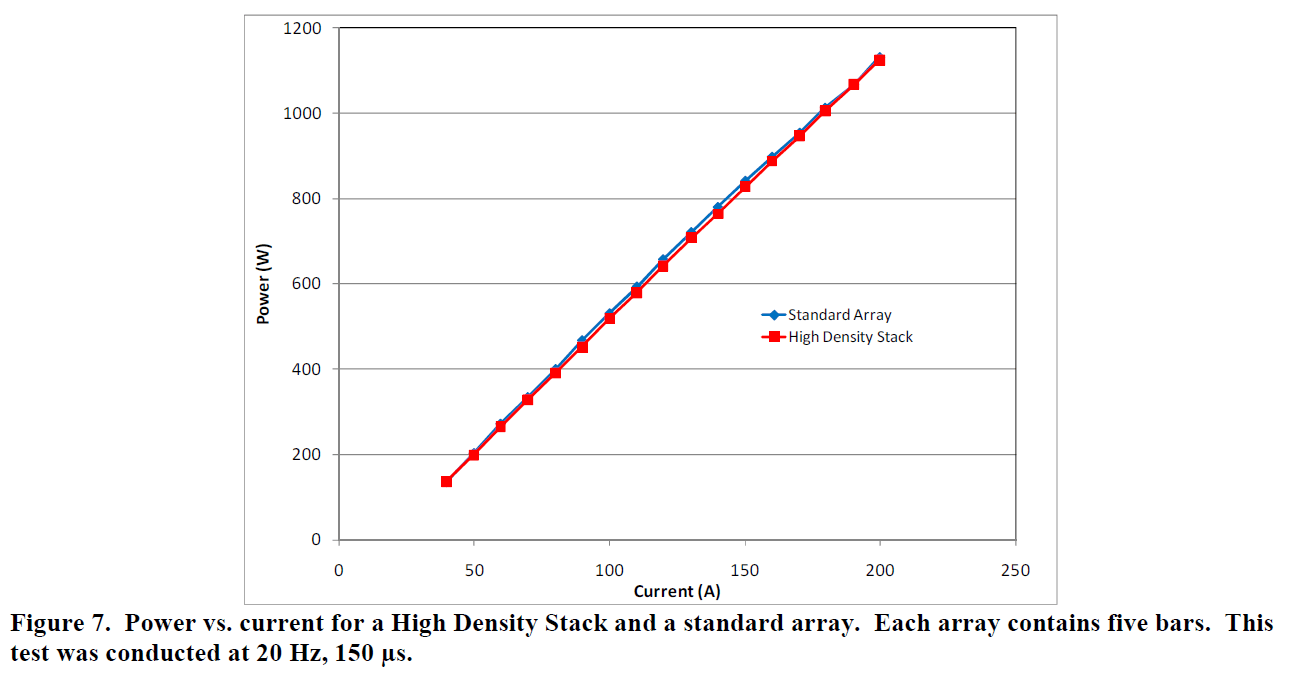
Power vs. current data was obtained for a 5-bar HDS array and compared to a 5-bar array built using standard manufacturing methods with bars located on a 400 µm pitch. The data was obtained at a repetition rate of 20 Hz and a pulse width of 150 µs and is shown in Figure 7. There is no discernible difference in output power between the two arrays over the range of test currents. Since 20 Hz, 150 µs is a very common drive condition for pumping Nd:YAG in SSL range finders, this test results validates the use of the HDS arrays in this regime.
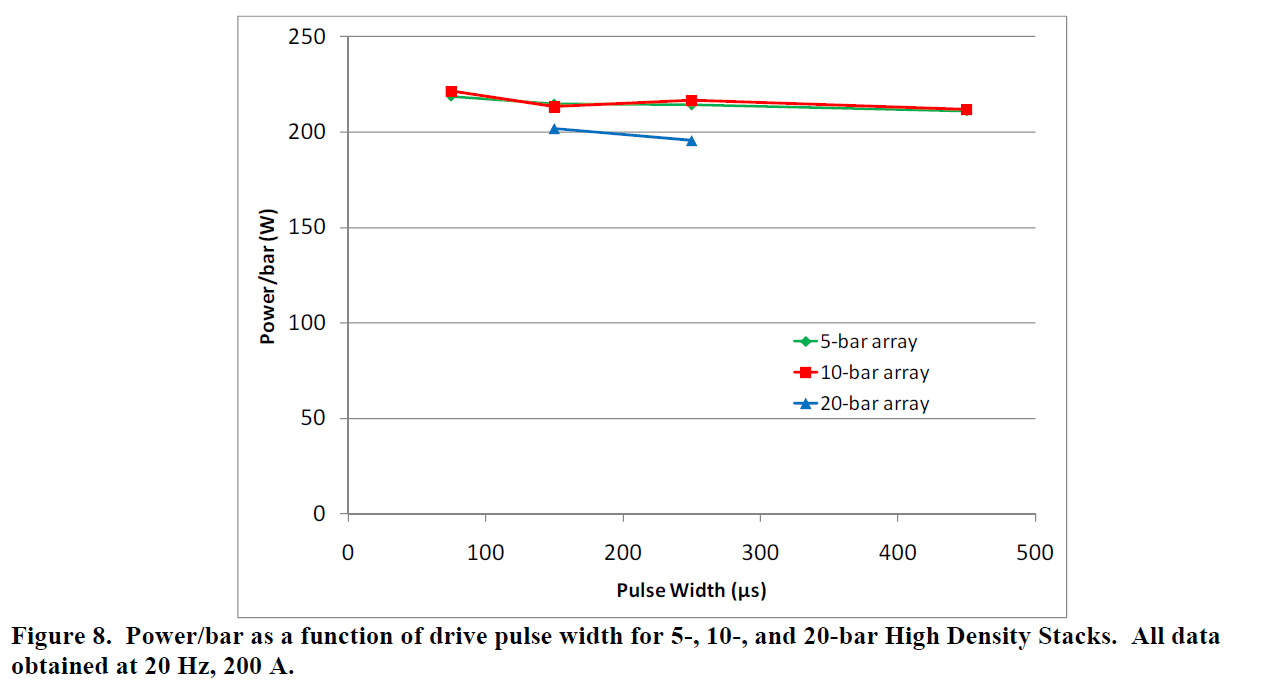
Additional testing was conducted to determine the effect of increasing the pulse width on the output power of the HDS arrays. Peak power/bar as a function of pulse width is presented in Figure 8. For this test, the repetition rate and drive current were held constant at 20 Hz, 200 A. For all three arrays the peak power decreases as the pulse width is increased due to heating throughout the device.
The 20-bar stack produced 94% of the power/bar as the 5- and 10-bar stacks at a pulse width of 150 µs. At first glance one would suspect that this was due to the presence of several missing emitters, as seen in Figure 6. However, only ~2% of the emitters are emitting significantly less power according to the near field image. Therefore one can conclude that the decrease in output power is likely due to some other factor, most likely excessive heating in the device. At a pulse width of 450 µs, the 20-bar array experienced thermal runaway and no meaningful data could be collected.
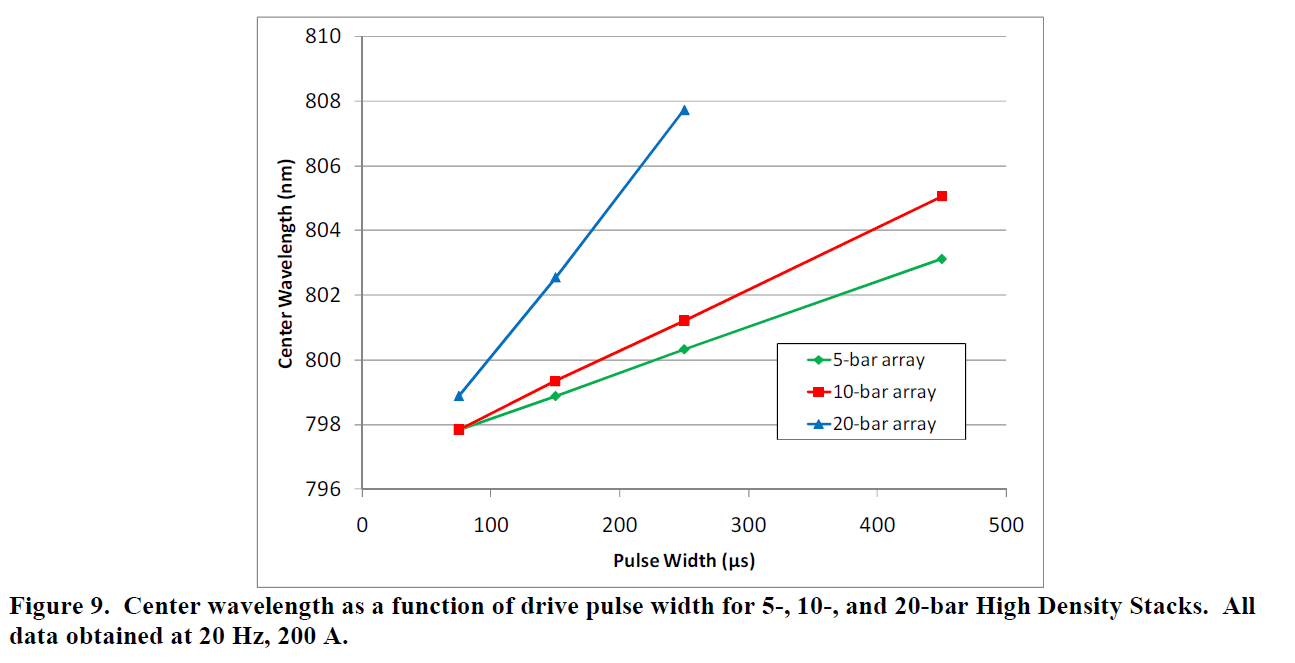
The relationship between the junction temperature of the device and the output wavelength is well understood, and scales at a ratio of ~ 0.25 nm/K for this material set. Because of this, measuring the output wavelength of the High Density Stack arrays provides a measure of the junction temperature. The center wavelength value for each array was collected during the testing of Figure 8, and is plotted in Figure 9. At low pulse widths (~ 75 µs), all three arrays have similar center wavelengths. The 5- and 10-bar arrays have the same center wavelength (to within the resolution of the measurement), and the 20-bar array is higher by ~ 1 nm.
The performance of the arrays begins to diverge as the pulse width (and therefore the average heat load) is increased. The 5- and 10-bar arrays have similar output wavelengths over the range of pulse widths in the test. At a pulse width of 450 µs, the wavelength of the 10-bar array is only ~ 2 nm higher than the 5-bar array. This corresponds to an average temperature increase of ~ 8K over the entire array. However, the center wavelength of the 20-bar array is a rapidly increasing function of pulse width.
It should be noted that at drive conditions common to Nd:YAG pumping for range finding applications, all three arrays were operating at junction temperatures less than what are typically experienced by CW arrays that are common in the industry today. Therefore at 20 Hz, 150 µs, and 200 A (~ 210 W/bar), all of the arrays are capable of high reliability operation.
3. FUTURE DIRECTION
The data presented above was based on NGCEO’s 200W laser diode bar. Recent advancements in epitaxial design have led to a bar that is capable of reliable operation at 300W (at approximately 300A). A comparison of the P-I curves for the two epi structures is shown in Figure 10.

The future direction of this project will be focused on the testing and evaluation of the new epitaxial structure in the HDS architecture. With reliable per-bar power levels in excess of 300 W, the HDS arrays will be capable of producing power densities approaching 25 kW/cm².
4. CONCLUSIONS
Northrop Grumman Cutting Edge Optronics has demonstrated a new laser diode array design capable of power densities of ~ 15 kW/cm² when operating at 200 W/bar. This array design, called the High Density Stack, enables high power densities by packaging the diode bars with a bar-to-bar pitch of ~ 150 µm.
NGCEO has collected data for 5-, 10-, and 20-bar arrays in the operating regime common to many Nd:YAG pumping schemes. The data collected from these experiments verifies that the arrays operate at junction temperatures that are suitable for long lifetimes.
Free Engineering Consultation>>
Impressive!